Enabling Container Memory Metrics on Raspberry Pi with cAdvisor
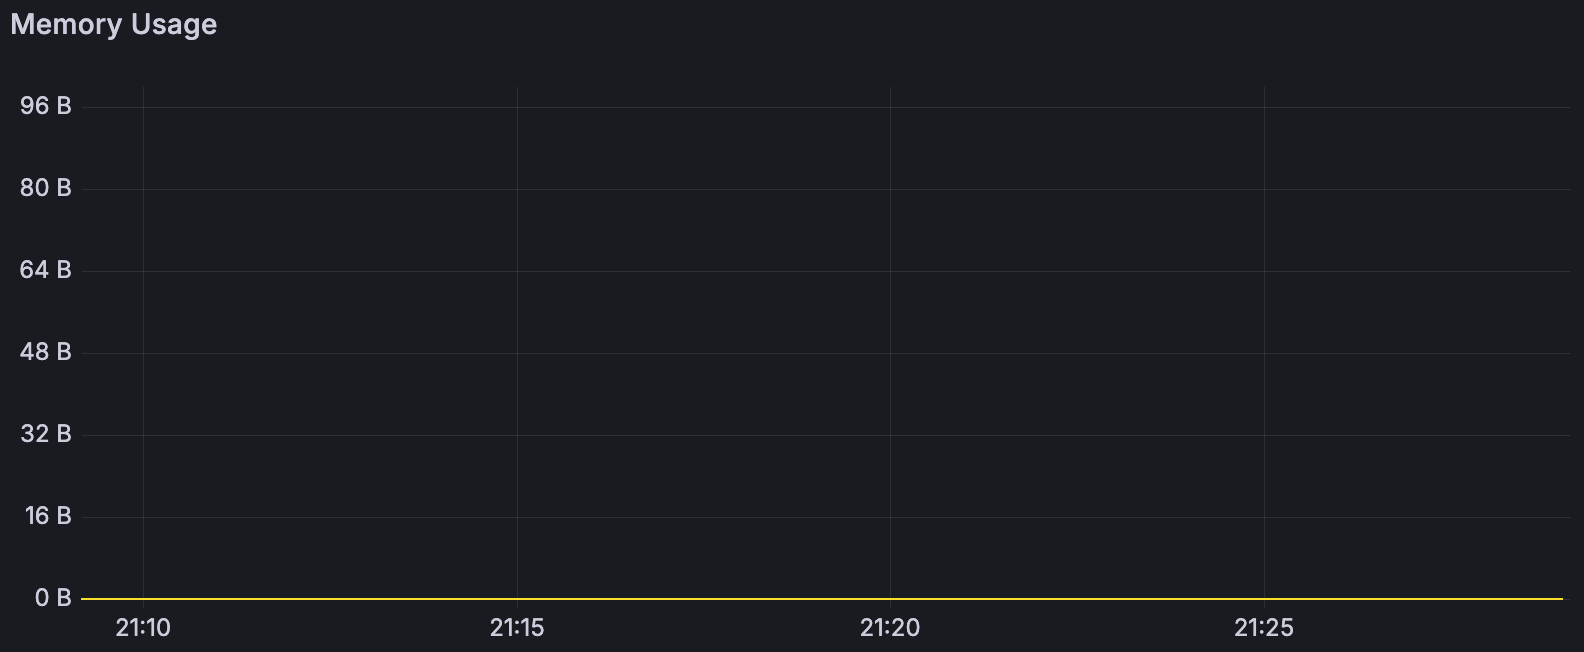
Setting up a monitoring stack on my Raspberry Pi sounded simple enough: Grafana, Prometheus, node-exporter, and cAdvisor. But something was off -container memory usage always showed zero in cAdvisor.
Everything else worked fine - CPU, network, disk, even host-level memory. But when it came to memory metrics inside containers? Nothing. After some digging, the issue was clear: missing cgroup flags in the Pi’s boot config.
The Root Cause
The issue wasn’t with cAdvisor or Prometheus. It was Docker itself, running without proper cgroup memory support. A quick check confirmed it:
docker info | grep -i cgroup
Output:
WARNING: No memory limit support
WARNING: No swap limit support
This means Docker can't read or enforce memory limits on containers - which also breaks memory metrics for monitoring tools like cAdvisor.
The Fix
On recent Raspberry Pi OS versions, the file to edit is:
/boot/firmware/cmdline.txt
Older guides might point to/boot/cmdline.txt, but that’s deprecated - newer images use/boot/firmware/cmdline.txt.
Append the following to the single line in cmdline.txt:
cgroup_enable=cpuset cgroup_enable=memory cgroup_memory=1
❗️ Keep everything on one line. Don’t create a new line.
Then reboot:
sudo reboot
What These Flags Do
cgroup_enable=cpuset: Enables assigning tasks to specific CPU cores.cgroup_enable=memory: Turns on memory tracking via cgroups.cgroup_memory=1: Actually enables the memory controller (some kernels need this explicitly).
After the reboot, run the check again:
docker info | grep -i cgroupNow those warnings should be gone and cAdvisor will finally report container memory usage correctly.
Done
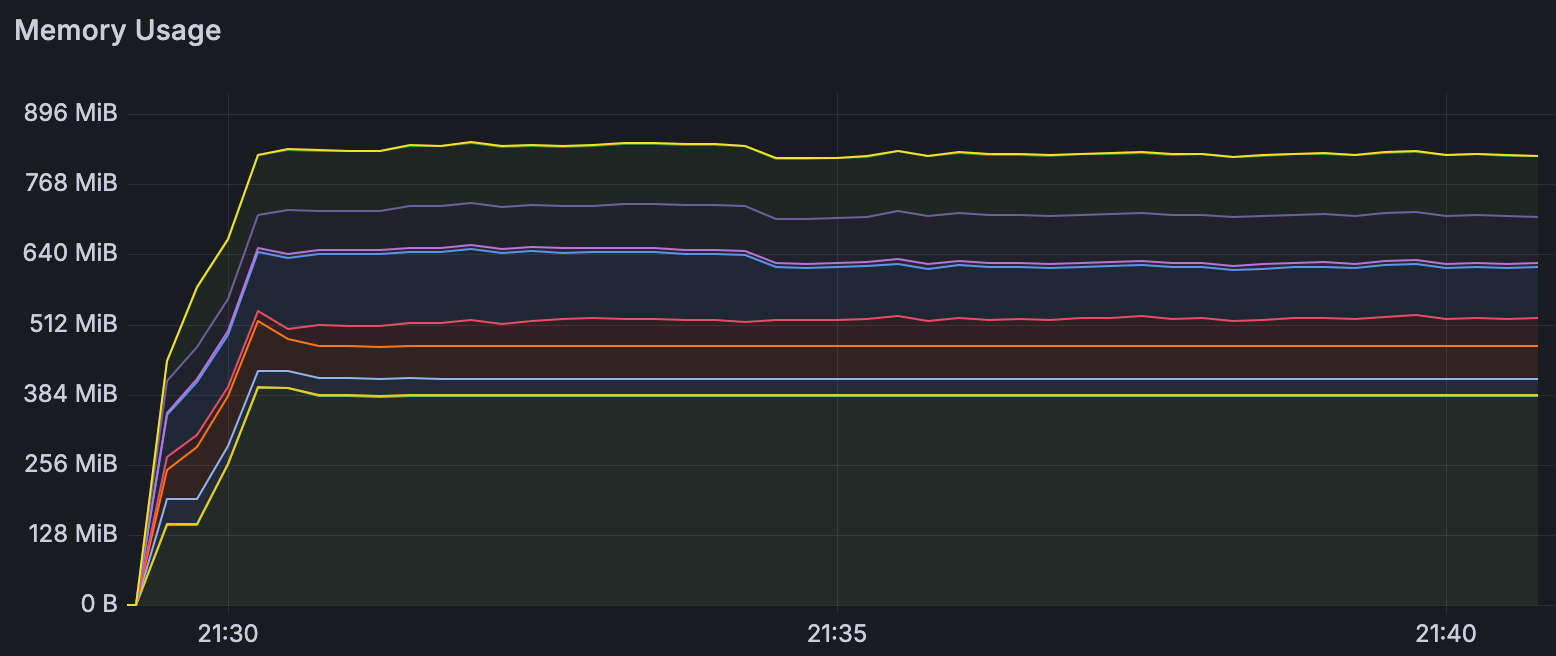
With those flags added, Prometheus and Grafana picked up real memory data from containers. No more blank graphs, no more confusion.
If you're using Docker and cAdvisor on a Raspberry Pi, this one-line tweak is essential for full container metrics.
Extra: Ansible Playbook
Here's an Ansible playbook to apply the fix automatically.
---
- name: Ensure cgroup options are present in cmdline boot file
  hosts: raspberrypi
  become: true

  vars:
    cgroup_options: "cgroup_enable=cpuset cgroup_enable=memory cgroup_memory=1"
    cmdline_path: /boot/firmware/cmdline.txt

  tasks:
    - name: Ensure cmdline.txt exists
      ansible.builtin.stat:
        path: "{{ cmdline_path }}"
      register: cmdline_stat

    - name: Fail if cmdline.txt does not exist
      ansible.builtin.fail:
        msg: "{{ cmdline_path }} not found on the target system."
      when: not cmdline_stat.stat.exists

    - name: Read current kernel command line
      ansible.builtin.slurp:
        src: "{{ cmdline_path }}"
      register: cmdline_raw
      when: cmdline_stat.stat.exists

    - name: Decode cmdline content
      ansible.builtin.set_fact:
        cmdline_decoded: "{{ cmdline_raw.content | b64decode | trim }}"

    - name: Update boot cmdline with cgroup options if missing
      ansible.builtin.copy:
        dest: "{{ cmdline_path }}"
        content: >-
          {{ (cmdline_decoded.split() + cgroup_options.split())
             | unique | join(' ') + '\n' }}
        backup: true
      when: cgroup_options.split() | difference(cmdline_decoded.split()) | length > 0